Whether you are validating the deployment of a new measurement solution, testing enhanced page tracking, or debugging an issue with your site, having quick access to the data your site measurement tool is collecting is a must.
I have used debugger tools provided by the web analytics vendors, I have used network analyzers like Charles, Ethereal, and Wireshark and tools built specifically for web analytics like WASP.
However, I find myself always going back to HttpFox. It’s Clean. It’s simple. It’s so easy to use, after I was introduced to it by my friend Michael Sanders, I went on to train everyone from quality assurance engineers to CEOs on how to use HttpFox to answer the question “what variables are we capturing on this page?”
How do I use HttpFox to validate my web analytics page tags?
1. Add the HttpFox Firefox extension to your browser.
2. Once you have installed the extension and have restarted Firefox, you will notice a new icon in your status bar.
![]()
3. Activate HttpFox by clicking the icon in the status bar.
![]()
4. Click the Start button and navigate to a page on your site. You will see a long list of records rolling in, don’t worry, in the next step we will talk about searching for the one record that matters.
5. Depending on what measurement solution you are using, the search string will be different. Here is a list of search strings that I use most often:
Google Analytics = _utm.gif
Yahoo Analytics = a.analytics.yahoo
Omniture = /b/ss/
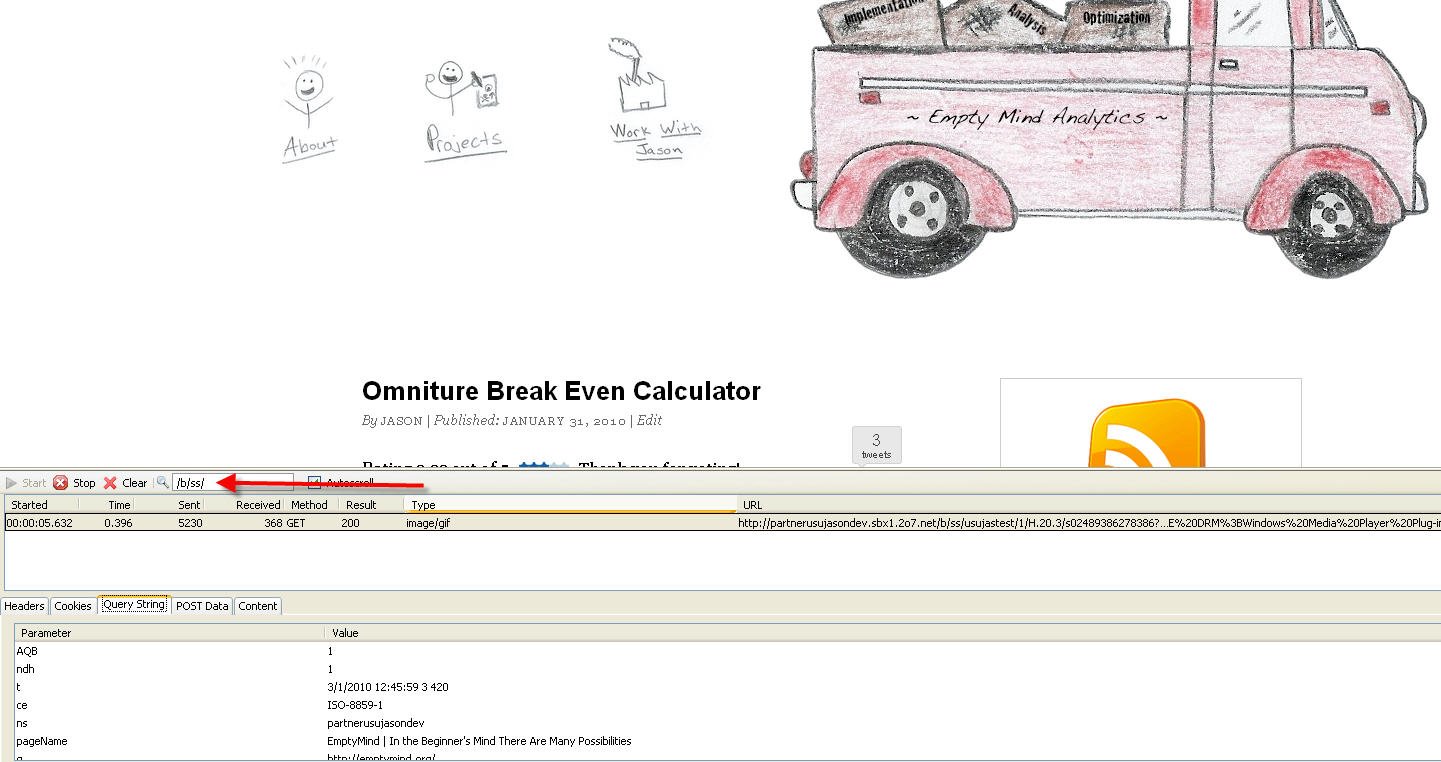
6. Click on the Query String tab and you can quickly see all the name-value pairs that are being sent to your analytics provider.
To take nothing away from HttpFox (which is awesome) I tend to use ‘Firebug’ and ‘Web Developer’ on a day-to-day basis (I mention only because you didn’t)
Thanks for the comment, Bob. Can you share what you like best about using ‘Firebug’ and ‘Web Developer’? I find myself using both of those products as well but not for validating measurement page tags. Interested in your feedback.
Habit really – although some of the DOM exploration/management is useful, as is some of the on-the-fly timing information.
That said, this has reminded me to come back and use httpfox more often.
I think you have to use multiple tools. I use firebug for most web dev debugging, and there is an add on to firebug called omnibug which will show you some decent info as well as tracking that happens with ajax calls.
But… I use WASP, TamperData, HttpFox as well. It just depends on the task at hand.
-Rudi
I completely agree Rudi. It really depends on the task you are trying to complete, there is not sense in using a hammer for every job when you have a toolbox readily available.
The one clear advantage that HTTPFox when looking to see whether Google Analytics is loading on not is the ability to quickly filter on the utm.gif and then take a look at the utmp variable is you’re using a customised pageview.
We shot a short video on this for a couple of our clients which can be seen at
http://www.alwaysbetesting.co.uk/google-analytics/using-httpfox-to-check-google-analytics-is-recording/