 Analyzing data programmatically seems to have finally taken hold in the digital analytics community. Traffic to my RSiteCatalyst documentation has skyrocketed, Jason has been on a Python kick lately (data cleaning, learning new analysis techniques) and I’m seeing other great posts from my peers, such as how to create a real-time dashboard using the Adobe Analytics API and 6 Marketing Tools [We Use] That No One Else Really Talks About.
That said, in many ways the digital analytics industry is just now catching up to where the direct mail/database marketing industry was decades ago. There is plenty of chatter about personalization strategies or A/B testing on websites, but seemingly much less effort is dedicated to understand which products are purchased together (and more importantly, what the non-obvious product combinations tell us about our customers).
Market Basket Analysis: Decades Old, As Relevant As Ever
Any merchandiser can tell you their top-selling product. If you ask what the top product combination is sold on their website, they might actually know (there’s a lot of sharp people out there!), but you’re also likely hear a guess like “multiple <variations> of <top-selling product>.” Obvious, but not very insightful.
The better question to ask is “What are some interesting product combinations that are being purchased, and should we be offering those to our customers?”. To answer this question, we can use Market Basket Analysis/Association Rules1, which will be the technical focus of this blog post using the arules package in R, along with RSiteCatalyst.
Obtaining Transaction-Level Data Using RSiteCatalyst
As mentioned above, database marketers have used this technique for ages, and transaction-level data is usually housed in a fulfillment database. However, for most (all?) e-commerce websites running Adobe Analytics, the data can also be obtained from the API with a few lines of R code:
Besides authentication, the script above serves two purposes:
- Check how many orders there were on Black Friday 2015, and
- Submits a QueueRanked() function call to pull orderid, product and units
The purpose of checking how many orders there were is to determine whether it makes sense to use a single API call or multiple for the QueueRanked() function. For the report suite I used, there were about 8,000 orders on Black Friday and it took the API 30 minutes to return the report. It’s likely the case that if I were to use multiple API calls that I would’ve received the answer faster (and if there were more orders, I definitely would’ve chosen to).
Visualizing Items Per Transaction
Before jumping into analysis, it’s always a great idea to visualize the data, to understand whether any additional pre-processing is necessary. Here’s a combination boxplot/rugplot showing the number of distinct items per transaction:
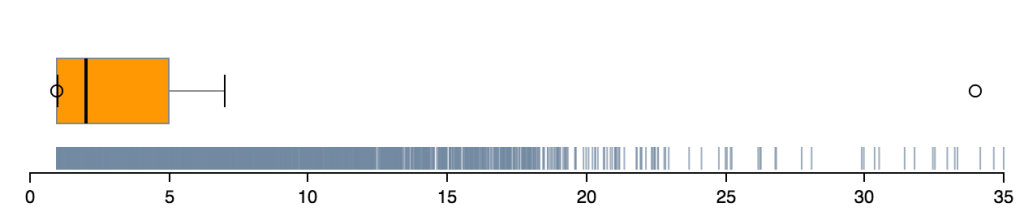
As expected, the data are truncated at a value of 1 (because we’re looking at orders data, the minimum has to be 1 item), which also represents our 25th percentile. 5 distinct items are the 75 percentile and overall, I would say that this data looks well-behaved such that no additional transformation is necessary.
Calculating Association Rules
With our data downloaded and validated, the next step is the fun part…running analysis! With 3 lines of code, we can start calculating our product associations:
For easier readability within RStudio, I convert the arules output to a data frame, which results in the following: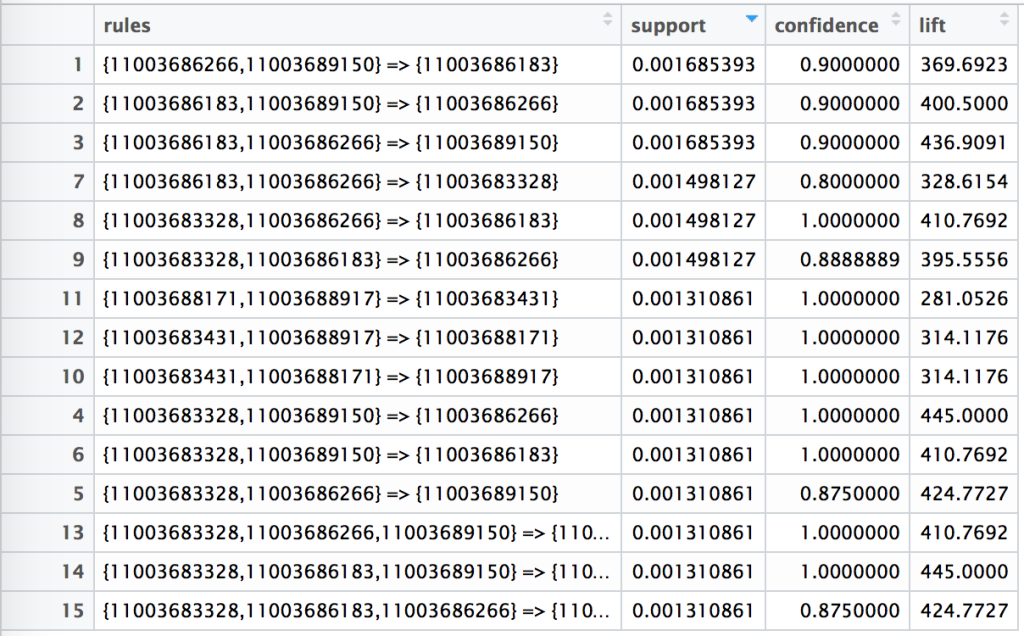
The table above shows the top 15 product basket combinations, sorted by support. In layman’s terms, support represents the percentage of all transactions where a product combination occurs. Confidence represents the number of transactions where the left-hand side (LHS) also had the product on the right-hand side (RHS). Like the rest of statistics, it doesn’t mean that the LHS causes RHS, just they are occurring together.
Implementation & Usage
Once you have your associations, you can begin to sort through what item combinations are “interesting” to your business. As mentioned above, this isn’t necessarily causation; this technique is very good at picking up website structure/recommender systems that may already be running on your site. If the LHS rules ALREADY show the RHS somewhere on your site, well, that’s just additional data confirming your current marketing strategies.
But if an association is showing a pattern in spite of your merchandising efforts, it may be worth testing out a few of the rules as shopping cart messages to see if you can get an increase in units-per-transaction. The customer is already making a purchase; getting them to add one more item is a much easier than getting a conversion in the first place…
Or maybe, use these associations in a post-transaction email. Or in magazine ads. Coupon code bundles. Anywhere you’re marketing to your customer, you should be trying to optimize your merchandising/messaging.
[1] For a thorough discussion of the conceptual underpinnings of Market Basket Analysis, see R for Marketing Research and Analytics by Christopher N. Chapman and Elea McDonnell Feit pp. 339-349 or the arules package vignette
[author] Randy Zwitch [author_image timthumb=’on’]https://33sticks.com/wp-content/uploads/2016/02/Randy-Zwitch.jpg[/author_image] [author_info]Randy is an analytical professional with broad experience in Energy, Financial Services, E-commerce, Consulting, and ‘Big Data’ Technology. He is also a passionate open-source contributor in the R and Julia programming communities. [/author_info] [/author]
Comments are closed.