
33 Sticks Co-Founder and Principal Analyst, Hila Dahan, presented an extremely popular session at this years Adobe Summit in Las Vegas. Hila’s session focused on using advanced Calculated Metrics in three highly valuable use-cases:
Forecasting – Introducing plan data into Analysis Workspace and creating pacing visualizations.
Statistical Significance – Calculating test results in Analysis Workspace and introducing discipline into a testing program.
Churn – Visualizing retention and churn in Analysis Workspace and understanding loyalty patterns.

There is a lot to unpack here, so if you didn’t attend Hila’s session, or you want a refresher, I highly suggest that you start by watching her session, on-demand at Adobe.com:
[icon name=”download” class=”” unprefixed_class=””] Watch Hila’s Adobe Summit Session on-demand [Adobe.com]
You can also self-pace through the material by downloading the slides Hila’s used in her session:
[icon name=”download” class=”” unprefixed_class=””] Download a copy of Hila’s presentation slides [33Sticks.com]
As you are watching the session or looking to re-create some of the advanced Calculated Metrics that Hila mentioned during her presentation, we have included screenshots of the calculations used below:
FORECASTING CALCULATIONS
Introducing Plan Data into Workspace and creating Pacing visualizations.
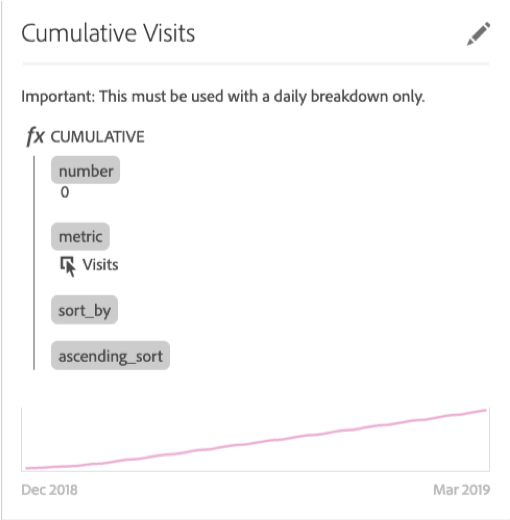
[icon name=”calculator” class=”” unprefixed_class=””] Cumulative Visit Counts
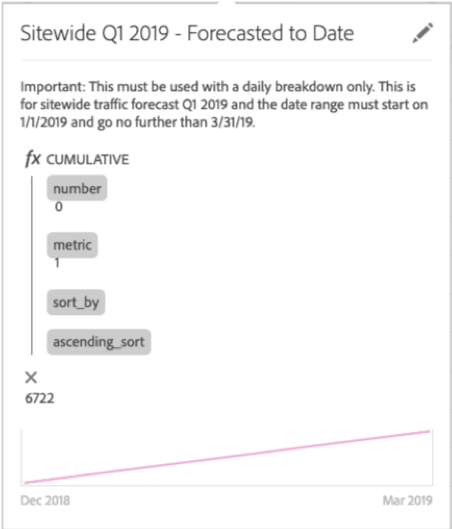
[icon name=”calculator” class=”” unprefixed_class=””] Cumulative Forecast to Date
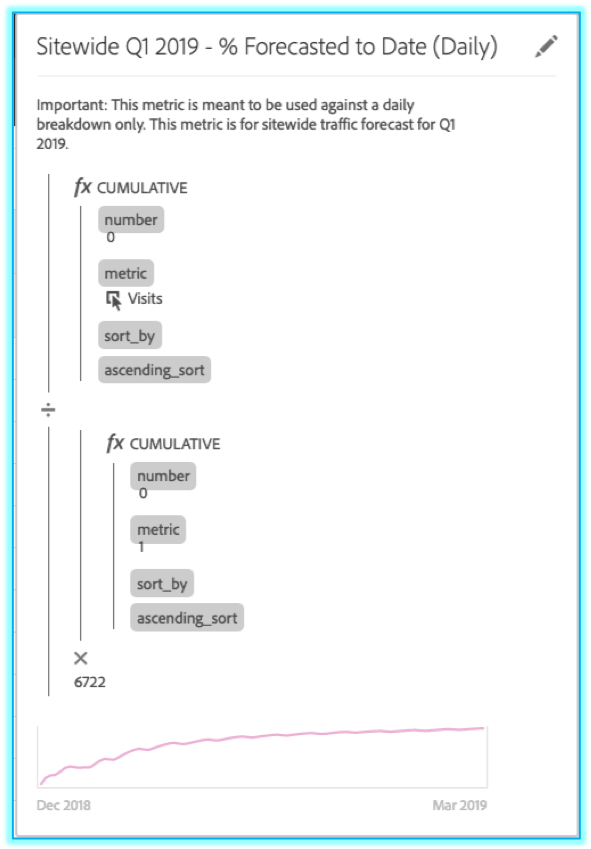
[icon name=”calculator” class=”” unprefixed_class=””] % Forecast to Date – Daily Pacing
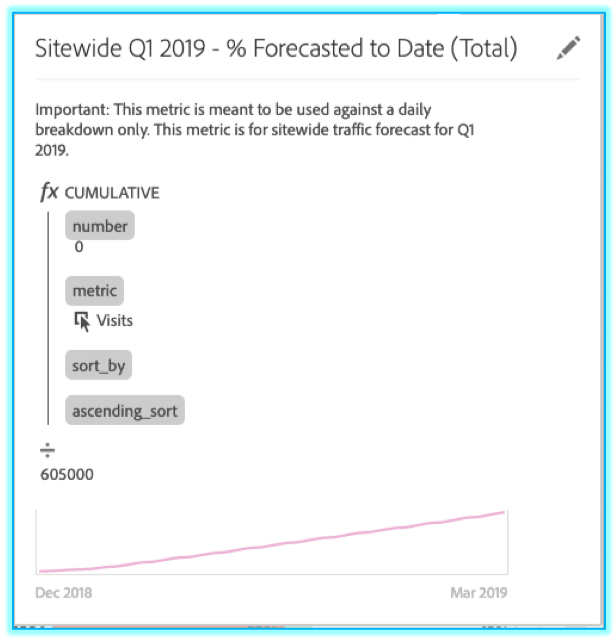
[icon name=”calculator” class=”” unprefixed_class=””] % Forecast to Date – Total Pacing
STATISTICAL SIGNIFICANCE CALCULATIONS
Calculating test results in Analysis Workspace and introducing discipline into a testing program.
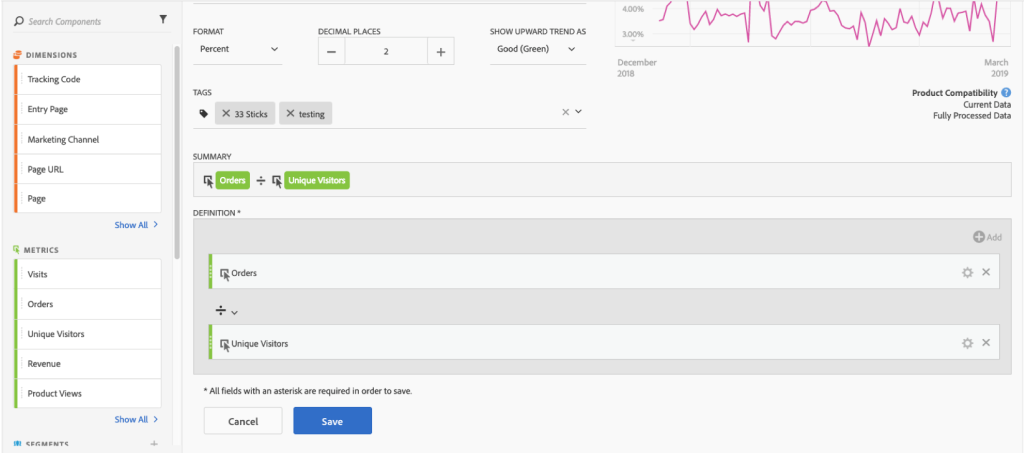
[icon name=”calculator” class=”” unprefixed_class=””] Conversion Rate
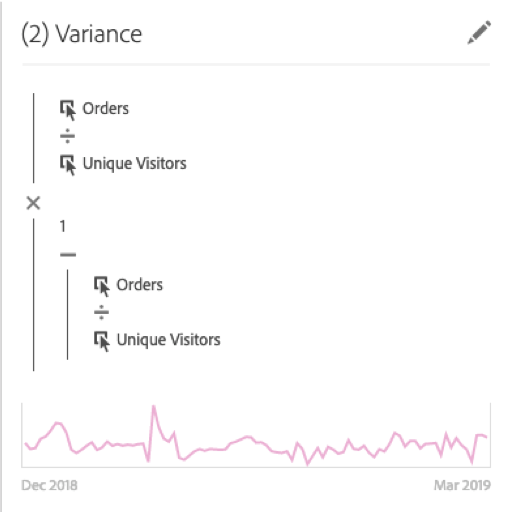
[icon name=”calculator” class=”” unprefixed_class=””] Variance
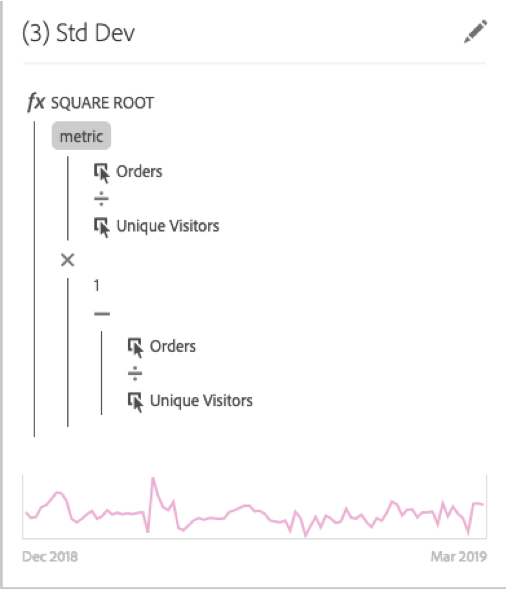
[icon name=”calculator” class=”” unprefixed_class=””] Standard Deviation
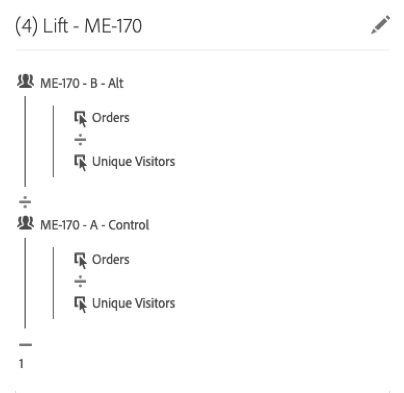
[icon name=”calculator” class=”” unprefixed_class=””] Lift
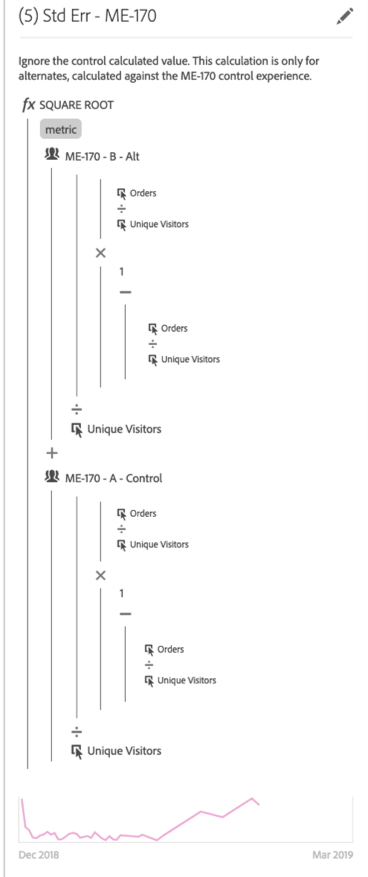
[icon name=”calculator” class=”” unprefixed_class=””] Standard Error
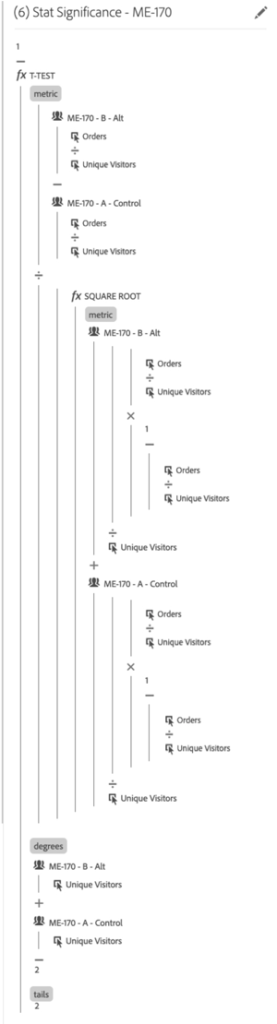
[icon name=”calculator” class=”” unprefixed_class=””] T-Test
CHURN CALCULATIONS
Visualizing retention and churn in Analysis Workspace and understanding loyalty patterns.
[icon name=”calculator” class=”” unprefixed_class=””] Monthly Cohort Segment

[icon name=”calculator” class=”” unprefixed_class=””] Moving Window Segment

[icon name=”calculator” class=”” unprefixed_class=””] Retention Rate
[icon name=”calculator” class=”” unprefixed_class=””] Churn Rate
You made it to the end, now enjoy a t-shirt canon shooting a t-shirt into the ceiling.